Seattle vs. Arizona Housing Market: 7.28% Rates, Rising Inventory, and the $2,000-a-Month Gap

Seattle vs. Arizona Housing Market: 7.28% Rates, Rising Inventory, and the $2,000-a-Month Gap
Market update as of October 4, 2026
Mortgage rates just jumped to 7.28%, their highest level since October 2023, according to reports on the latest Freddie Mac survey. King County has about 2.7 times as many homes for sale as it did in August 2021. Phoenix buyers are suddenly sitting on the sidelines. If you're a Seattle homeowner thinking about a move to Arizona, this is the most interesting moment to run the numbers in a long time.
Here is exactly what is happening in both markets right now, what it means for your monthly payment, and where the opportunities are hiding.
The Headline: Rates Just Hit 7.28%
On October 1, Freddie Mac reported the average 30-year fixed mortgage rate at 7.28%, up from 7.03% the week before and up from 6.34% a year ago. The 15-year fixed came in at 6.60%, up from 5.55% a year ago.
That is a big move in a short time, and it lands on both markets at once. The difference is how each market is absorbing it.
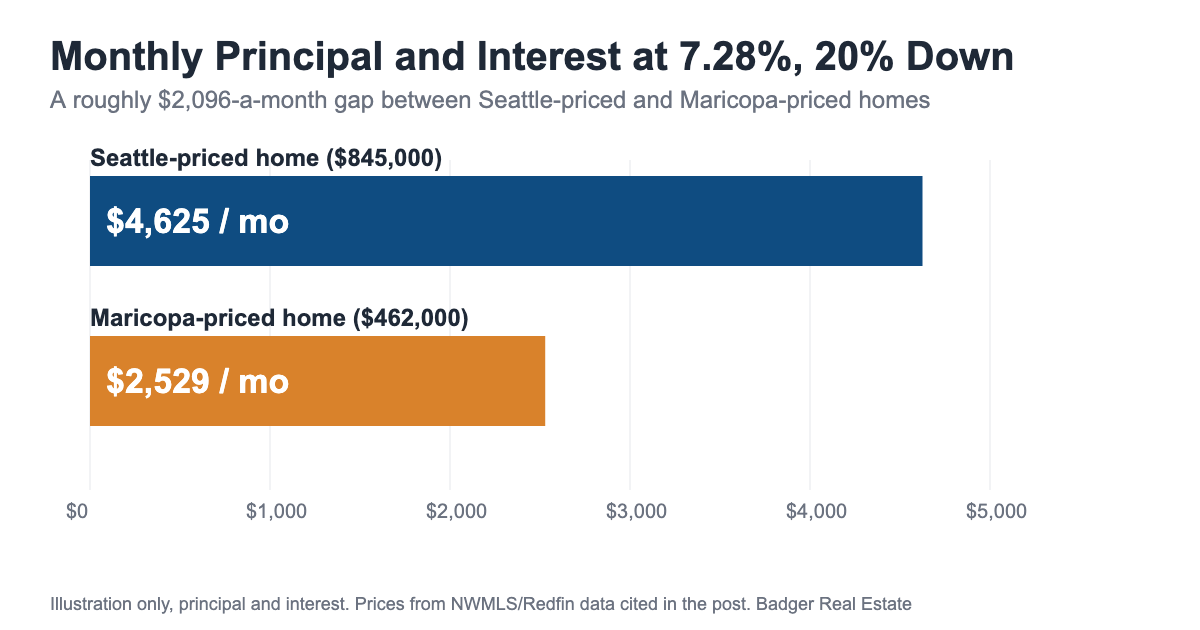
What a one-point rate jump does to a real payment (illustration): on a Seattle-priced home of $845,000 with 20% down ($676,000 loan), the principal-and-interest payment at 7.28% is about $4,625 a month. At last year's 6.34%, the same loan was about $4,202. That is roughly $423 more every month, or over $5,000 a year, for the same house. (Principal and interest only. Taxes, insurance, and HOA are extra, and your actual rate will vary. Talk to your lender for a real quote.)
Market Snapshot: Seattle vs. Arizona
|
Seattle / King County |
Phoenix / Maricopa County |
|
|---|---|---|
|
Median price |
$845,000 (Seattle, September) |
$462,000 (Maricopa, August) |
|
Price vs. last year |
Down 2.9% (Seattle) / Down 4.0% (King County, August) |
Flat |
|
Median days on market |
22 days (Seattle, September) / 37 days (King County, August) |
64 days (Maricopa, August) |
|
Active listings |
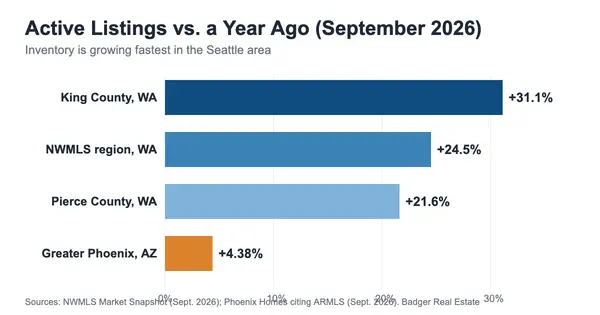
8,876 in King County, up 31.4% from last year |
20,462 in Maricopa, up 0.5% from last year |
|
Months of supply |
About 4.7 |
About 3.6 (Maricopa), 4.28 (Greater Phoenix metro) |
|
Closed sales vs. last year |
Down 15.4% (King County, August) |
Down 4.9% (Maricopa, August) |
|
Sale-to-list price |
96.2% (King County) / 99.1% (Seattle city) |
98.1% |
Sources are listed at the bottom. Seattle and King County numbers come from NWMLS data; Maricopa numbers come from Phoenix REALTORS data as reported by local market sites. City-level and county-level figures differ, which is why both appear.
Seattle: Inventory Is the Story
Seattle's story right now is supply. King County had 8,876 active listings in August, up 31.4% from a year earlier. Five years ago, in August 2021, there were 3,240. That is about 2.7 times as many homes on the market.
What that looks like on the ground:
- Prices are softening. The King County median slipped 4.0% year over year. Seattle's city median is $845,000, down 2.9%, with single-family homes at a median of $982,500 and condos and townhomes at $625,000.
- Sales are slower. Closed sales in King County dropped 15.4% year over year in August.
- Homes take a little longer. King County days on market rose 12.1% to 37 days. Seattle city properties are still moving in about 22 days, a reminder that well-priced, well-presented homes in good locations still sell fast.
- Sellers are negotiating. Homes are selling at about 96 to 99 percent of list price depending on the area.
The takeaway: Seattle is not crashing, but the days of a bidding-war-by-default are over. Buyers have choices, and sellers who price correctly from day one are the ones who still win.
Arizona: The Slowdown Nobody Expected
Maricopa County prices are holding flat at around $462,000 for resale homes, but under the surface something notable is happening: pending sales dropped 34.2% to 2,602 in the most recent report, the third month in a row of 30%-plus declines, according to market analysis of Phoenix REALTORS data. Buyers are hesitating, likely because of rates.
Other signals worth knowing:
- Days on market are long. Maricopa homes take a median of 64 days to sell. In the city of Phoenix, single-family homes were at 70 days in early September, up from 65 the month before.
- Inventory is stable, not surging. Active listings in Maricopa are up just 0.5% year over year at about 20,462.
- The metro just crossed into balanced territory. Greater Phoenix reached 4.28 months of supply, crossing the balanced-market threshold for the first time in roughly a year.
- Pricing is sticky. Phoenix city single-family median sold price was $464,990 in early September, down from $479,500 a year earlier.
- Sellers are still getting close to list. The sale-to-list ratio is about 98 percent.
The takeaway: Arizona is not overheated and not collapsing. It is a market where buyers have time, negotiating room, and in some pockets, builder incentives.
The Number That Gets Seattle Homeowners' Attention: The $2,000 Gap
This is the comparison most Seattle-to-Arizona movers care about most.
|
Illustration at 7.28%, 20% down |
Seattle-priced home |
Maricopa-priced home |
|---|---|---|
|
Price |
$845,000 |
$462,000 |
|
Loan amount |
$676,000 |
$369,600 |
|
Principal and interest |
about $4,625 per month |
about $2,529 per month |
That is a difference of roughly $2,096 a month, or about $25,000 a year, in principal and interest alone, before you compare property tax (Arizona's effective rate is lower than Washington's) and heating, cooling, and insurance costs, which vary by home. This is general information, not tax or lending advice; your CPA and lender can model your exact situation.
For a Seattle homeowner who sells, the equity from a Seattle sale can mean a much larger down payment in Arizona, which shrinks the loan and the payment even more.
Five Things Seattle Sellers and Arizona Buyers Should Do Right Now
- Price your Seattle home for today's market, not last spring's. With inventory up more than 30 percent, the sellers who price to current comparables sell faster and closer to list.
- Do not wait for rates to "come back down" before you look. Nobody knows where rates go next. Looking, getting pre-approved, and understanding your numbers costs nothing.
- Use Arizona's slower pace to your advantage. With homes averaging two months on the market, you can tour carefully, negotiate repairs, and ask about seller credits.
- Look at the edges of the Valley. In outer areas, builders have been offering rate buydowns and closing cost credits to move inventory, according to local market reports.
- Coordinate the timing of both sides. Selling in Seattle and buying in Arizona has moving pieces: closing dates, contingencies, bridge options. Having one team handle both sides keeps it calm.
What We're Watching Next
- NWMLS and Phoenix REALTORS September reports, expected in the coming days, will show whether Seattle inventory is peaking and whether Arizona pending sales recover.
- The next Freddie Mac rate readings each Thursday. A move back toward the 6s would change buyer behavior quickly, in both states.
- Seasonal timing. Local reports note Seattle prices could soften heading into January, based on past seasonal patterns.
Frequently Asked Questions
How much lower is the monthly payment in Arizona than in Seattle?
At a 7.28% rate with 20% down, the illustration in this post shows about $4,625 a month in principal and interest on an $845,000 Seattle-priced home versus about $2,529 on a $462,000 Maricopa-priced home, a difference of roughly $2,096 a month. This is principal and interest only; taxes, insurance, and HOA are extra, and your actual rate will vary.
Is inventory rising in Seattle?
Yes. The data cited in this post shows about 8,876 active listings in King County, up 31.4% from a year earlier, giving buyers more choice than they have had in years.
Are Arizona homes taking longer to sell?
In Maricopa County, the median time on market was about 64 days in August, and active listings were up only about 0.5% from a year earlier, so the market is calmer and buyers have more time to decide.
Can one team help me sell in Seattle and buy in Arizona?
Yes. Badger Real Estate specializes in Seattle to Arizona moves and coordinates both sides of the transaction.
Thinking About Seattle to Arizona?
We specialize in exactly this move: selling in the Seattle area and buying in Arizona, with one team handling both sides. Scott is a certified appraiser with 12,000-plus appraisals completed, so when we tell you what your Seattle home is worth, it is not a guess. Alayna has lived in the Phoenix area for seven years and knows Mesa, Tempe, Gilbert, Chandler, and Scottsdale neighborhood by neighborhood.
Want a free home value estimate for your Seattle home, plus a look at what that equity buys in Arizona? Call or text 206-402-8518, or download our free Arizona Relocation Guide.
Related Reading
- Biggest Changes When Moving from Seattle to Arizona
- What $500k Gets You in Seattle vs. Mesa, AZ
- Which Arizona City Is Actually Right for You?
- How to Improve Your Credit Before Buying a Home in Arizona
- Dream Home Questionnaire: Tell Us What You Want in Your Arizona Home
#seattlerealestate #arizonarealestate #seattletoarizona #relocatetoarizona #badgerrealestate
This post is general market information, not tax, legal, or lending advice. Figures are from the sources below as of the dates noted and may be revised. Mortgage payment examples are illustrations only.
Sources
- Freddie Mac, "Mortgage Rates Average 7.28%," October 1, 2026: Freddie Mac press release
- NWMLS August 2026 data via Connecting You Home, "September 2026 Seattle Housing Market Update": Connecting You Home report
- NWMLS Seattle city data, September 2026, via Beyond WA: Beyond WA Seattle market report
- North End Homes, "Seattle-Area Housing Market: What to Expect in October 2026": North End Homes October outlook
- Maricopa County data (Phoenix REALTORS, August 2026) via Unbiased Options: Unbiased Options Maricopa statistics
- Phoenix city data (Cromford Report, September 10, 2026) via AZ Andrea: AZ Andrea Phoenix report
- Builder incentives and East Valley context via Gluch Group (Cromford Report, May 2026): Gluch Group Phoenix analysis
Categories
Recent Posts